Gender parity: Key trends in women's empowerment
To celebrate the many accomplishments by women and acknowledge the on-going efforts for gender parity, this issue of the Criterion of the Month explores the evolution of three key areas of women participation and decision-making in the last decade.
 Women on boards
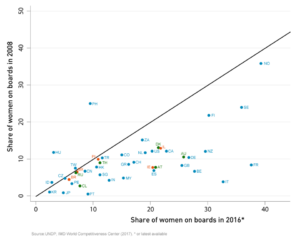
The following graph captures the significant increase in the percentage of board seats held by women in the last eight years. The horizontal axis reports the percent of women’s on boards in 2016, or the latest available year. Conversely, the vertical axis conveys the share of women for 2008. The red line is the 45-degree curve. If the share of women in boards of a country is the same in the two years under consideration, then the country will be on the 45 degree line. All the countries that are below the 45-degree line are characterized by a higher percentage of women on boards in 2016 compared to 2008.
Except Hungary, Philippines and marginally Indonesia, the number of women participating in boards has increased substantially. The increase may be the outcome of laws that require improving the representation of women in boards, as is the case in most European countries or voluntary effort, as is the 30% Club in Britain, the outcome is the same: the last eight years have been characterized by a strengthening of women in the business dimension.
Graph 1 : share of women on boards
 Women in Parliament
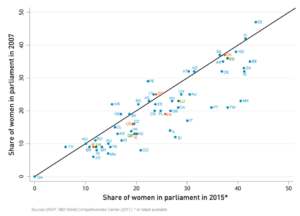
A similar positive trend is recognized if one examines the proportion of seats held by women in the parliaments of the fifty economies we have data for. Graph 2 clearly shows that there is an increased presence of women in 2015 compared to 2007. There are only fifteen economies, some of them only marginally, that experienced a decline in the share of female politicians. As a whole, the trend captures an increasing presence of women in the political decision-making sphere.
Graph 2: Women in parliament
 Women in research
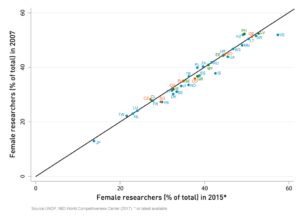
Our data does not provide a similar positive trend for women researchers. We approached the topic of gender and R&D in our last Criterion of the Month. Studying the evolution in the percent of women researchers between the years 2015 and 2007 remains the same. As we suggested before, young women may be discouraged at a young age to follow the path of science and research. Or, their expectations for potential employment are very low and thus prohibitive for making such a commitment. This area needs to be improved upon.
Graph 3: Women in research
 Gender equality
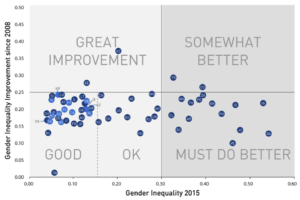
The final graph shows how much a country has improved its Gender Inequality from 2008 to 2015 in the vertical axis and the most recent Gender Inequality level in the horizontal axis. By taking the mid-points of the range for the two axes, we can identify four areas of interest. The northern quadrants capture the countries that have empowered women the most in the last eight years, while the western quadrants show those that are least unequal, the positive aspect of this analysis is that most of the economies studied belong in these quadrants! The two countries that exhibited the most impressive improvement are that of Estonia and Kazakhstan. Conversely, the countries in the south-east quadrant are those where there is a lot of room for improvement.
Graph 4: gender equality
Many countries and institutions realize that the best results are achieved when the most capable people occupy positions related to business, government or research irrespective of gender. In order for further improvement to be materialized, countries need to work harder to close the gender gap.
Research Information & Knowledge Hub for additional information on IMD publications
The case study delves into strategic transformation and leadership transitions at Unilever since 2009. Unilever has been an industry leader of busi...
Many executives say they don’t have time for mindfulness practices, such as daily meditation. An alternative is micro-presence: weaving moments of ...
Earlier this month, the European Union began executing its tariffs on China for electric vehicle (EV) imports, yet the dated practice of taxing pro...
Research Information & Knowledge Hub for additional information on IMD publications
Research Information & Knowledge Hub for additional information on IMD publications
Research Information & Knowledge Hub for additional information on IMD publications
Research Information & Knowledge Hub for additional information on IMD publications
Research Information & Knowledge Hub for additional information on IMD publications
Research Information & Knowledge Hub for additional information on IMD publications
Research Information & Knowledge Hub for additional information on IMD publications
Research Information & Knowledge Hub for additional information on IMD publications
Research Information & Knowledge Hub for additional information on IMD publications
Research Information & Knowledge Hub for additional information on IMD publications

 Women in Parliament
 Women in research
 Gender equality


