What makes a city liveable and smart?
Smart City Observatory
What makes a city liveable and smart?
Smart City Observatory
In 2017, our two institutions, IMD and Singapore University of Technology and Design (SUTD), decided to join forces to produce a smart city index offering a balanced focus on economic and technological aspects of smart cities on the one hand, and “humane dimensions” of smart cities (quality of life, environment, inclusiveness) on the other.
The initial effort to produce what should become an internationally recognized global smart city index consists of two distinct phases and deliverables.
First, a set of case studies of smart cities at different stages of development, providing a diverse international basis of experience, with the purpose of enhancing the realism and pertinence of the model underpinning the index to be proposed.
Sixteen Shades of Smart has been awarded the bronze medal in the Business Intelligence/Innovation category at the Axiom Book Awards.
Second, the first iteration of the index methodology was defined, leading to a global ranking of smart cities along that index in 2019. Now we are proud to present the third edition.


Smart City Index 2021
The third edition of the annual IMD-SUTD Smart City Index (SCI) has revealed that city-dwellers’ perceptions of how technology is helping to address urban challenges have been highly affected by the pandemic and its acceleration of digital transformation.
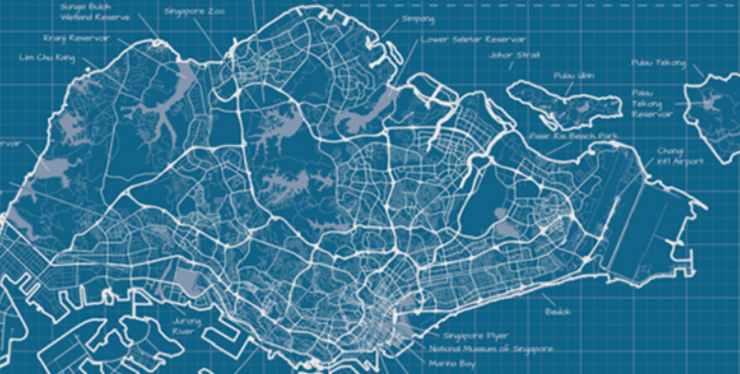
Taking the top three places were Singapore (1st), Zurich (2nd) and Oslo (3rd). Switzerland enjoyed three cities in the top 10 with Lausanne in 5th and Geneva in 8th place.
The Institute for Management Development, in collaboration with Singapore University for Technology and Design (SUTD), has released the 2021 Smart City Index, with key findings on how the rapid spread of COVID-19 among urban populations has led city leaders to face new responsibilities.
Hundreds of citizens from 118 cities were surveyed in July 2021 and asked questions on the technological provisions of their city across five key areas: health and safety, mobility, activities, opportunities, and governance.
Browse the full report
Extended profiles in PDFs. Using the methodology applied to the first three editions (2019, 2020, 2021). The methodology then changed in 2023.


Cities in a Time of Global Emergencies
Edited by Professor Arturo Bris, Christos Cabolis, Chan Heng Chee, and Bruno Lanvin.
This is the second volume of smart cities case studies published as a companion to the IMD-SUTD Smart City Index. It follows the award-winning ‘Sixteen Shades of Smart’, released in 2019.
Although the world is not out of the pandemic yet, important lessons have been learned from the ways in which cities (and smart cities in particular) have adopted innovative strategies to face the massive challenges of a health crisis. At the same time, citizens’ concerns about climate change and the environmental challenges stemming from rapid urbanization have continued to gather momentum around the world. Smart cities are places where the convergence is rapidly increasing between concerns for health on one hand and concerns about climate change on the other.
The ten case studies contained in ‘Cities in a time of global emergencies’ describe and analyze the experience and strategies of smart cities from Africa, Europe, Asia, and the Americas. Some of them are just starting their smart city journey, while others have already gone through several versions of their strategy to respond to their citizens’ needs by becoming even smarter. The comparison of the approaches taken is a source of factual knowledge about the possible future of smart cities and casts a new light on what their options might be in the face of today’s and tomorrow’s emergencies.
Browse the abstract
Sixteen shades of Smart: How cities can shape their own future
Smart cities are a fast-growing species, and a fascinating field for new experiments in a number of critical areas, ranging from urban planning, sustainable energy, and transport strategies to social integration and talent attraction, to name a few. As leaders and citizens around the world continue to assess, design, implement and improve on ways to create better cities, they often find themselves confronted with a multitude of decisions and a wide range of partial solutions to specific problems such as traffic congestion, waste management and crime.

It includes 16 case studies, produced by the Lee Kuan Yew Centre for Innovative Cities at SUTD (covering Asia and the Pacific) and the IMD World Competitiveness Center (covering other parts of the world). Producing these studies has yielded important lessons about how to enhance the value and uniqueness of our smart city index, as well as precious insights on how our two institutions can work together in a very synergistic way to produce unique insights.
Sixteen shades of Smart has been awarded the bronze medal in the Business Intelligence/Innovation category at the Axiom Book Awards.