

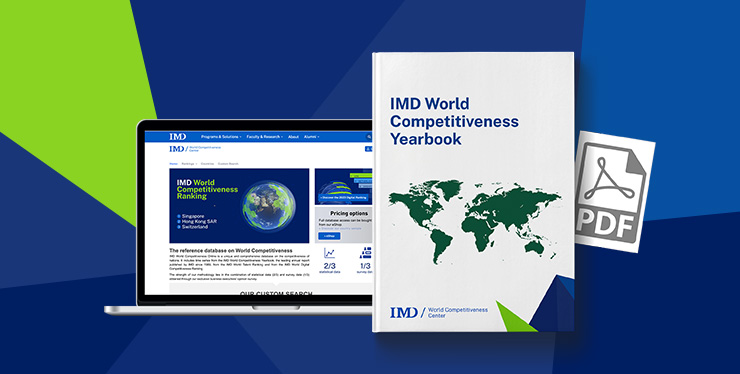
A comprehensive annual report and a globally renowned reference point for governments and the private sector
World Competitiveness Ranking
A comprehensive annual report and a globally renowned reference point for governments and the private sector
A word on “competitiveness”
An economy’s competitiveness cannot be reduced to its GDP, productivity, or employment levels; it can be gauged only by considering a complex matrix of political, social, and cultural dimensions.
Economic competitiveness is synonymous with people’s quality of life, and governments play just as important a role as companies. How? Why? And in what ways does the constantly evolving macroeconomic landscape have an impact?
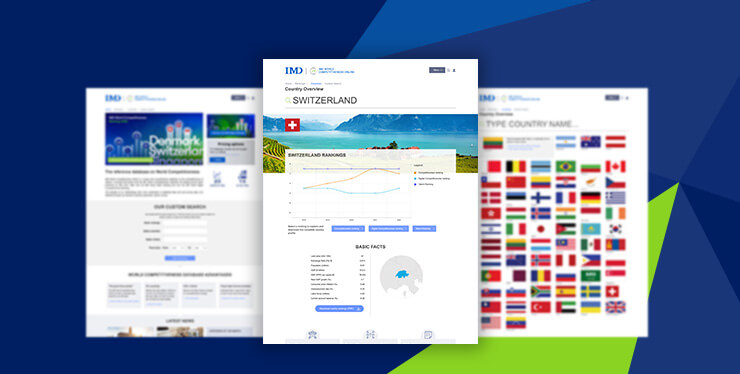
The IMD World Competitiveness Center, with its flagship World Competitiveness Ranking, has for 38 years provided data and analysis on just this.
It takes a global, regional, sub-regional, economic, and “people” lens, using external hard data and the results of a home-grown survey of senior executives in 70 global economies.
The latest edition was released in June 2026.


Register to receive the latest news and events from IMD’s World Competitiveness Center