

Thrive with China’s ecosystem
China Initiative
Thrive with China’s ecosystem
With our strong intellectual foundation and our extensive experience working with multinational corporations and leading Chinese companies in China, IMD provides increasingly sought-after research, insights and in-country practice into what it takes to thrive in this complex and important market.
Explore our latest research and insights into the incredible cross-sector innovation happening in China.
by Mark J. Greeven, Fabrice Beaulieu and Wei Wei in HBR

by Mark Greeven
by Stéphane J. G. Girod
I by IMD Spotlight Report 2026
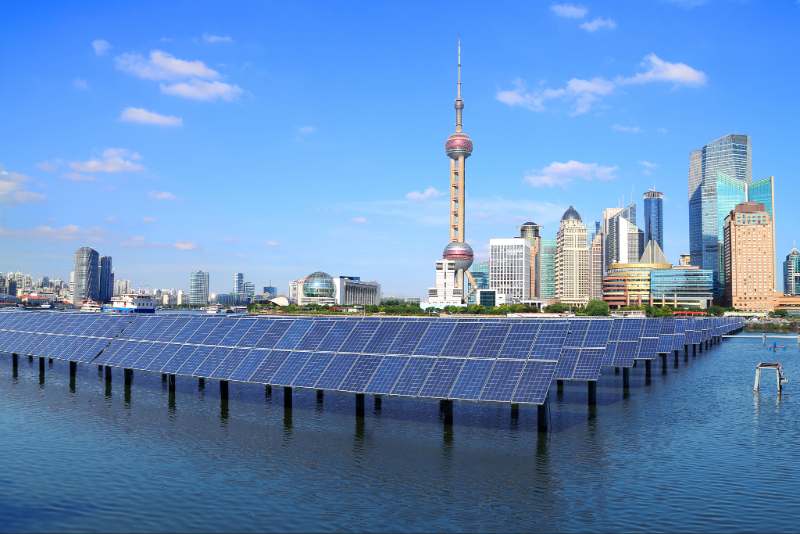
China’s Energy Transition
From megawatts to market power:
How China’s energy transition is reshaping global business
China’s wind and solar capacity overtook coal in 2025, marking a turning point for business. After two decades of rapid renewable expansion, the challenge is now turning abundant clean energy into a competitive industrial advantage.
For executives, this is not a distant sustainability issue. It is a live test of investment decisions, carbon-risk management, and future competitiveness. What can business leaders learn from the world’s largest energy transformation?
Our latest China Company Transformation Indicator (CCTI) focuses on six sectors. The objective of the Indicator is to reshape how these sectors are understood and evaluated in China, particularly in regard to companies’ readiness to transformation and thrive on the long term.


Our extensive library of case studies on China translate research into action.