Doing well by doing good
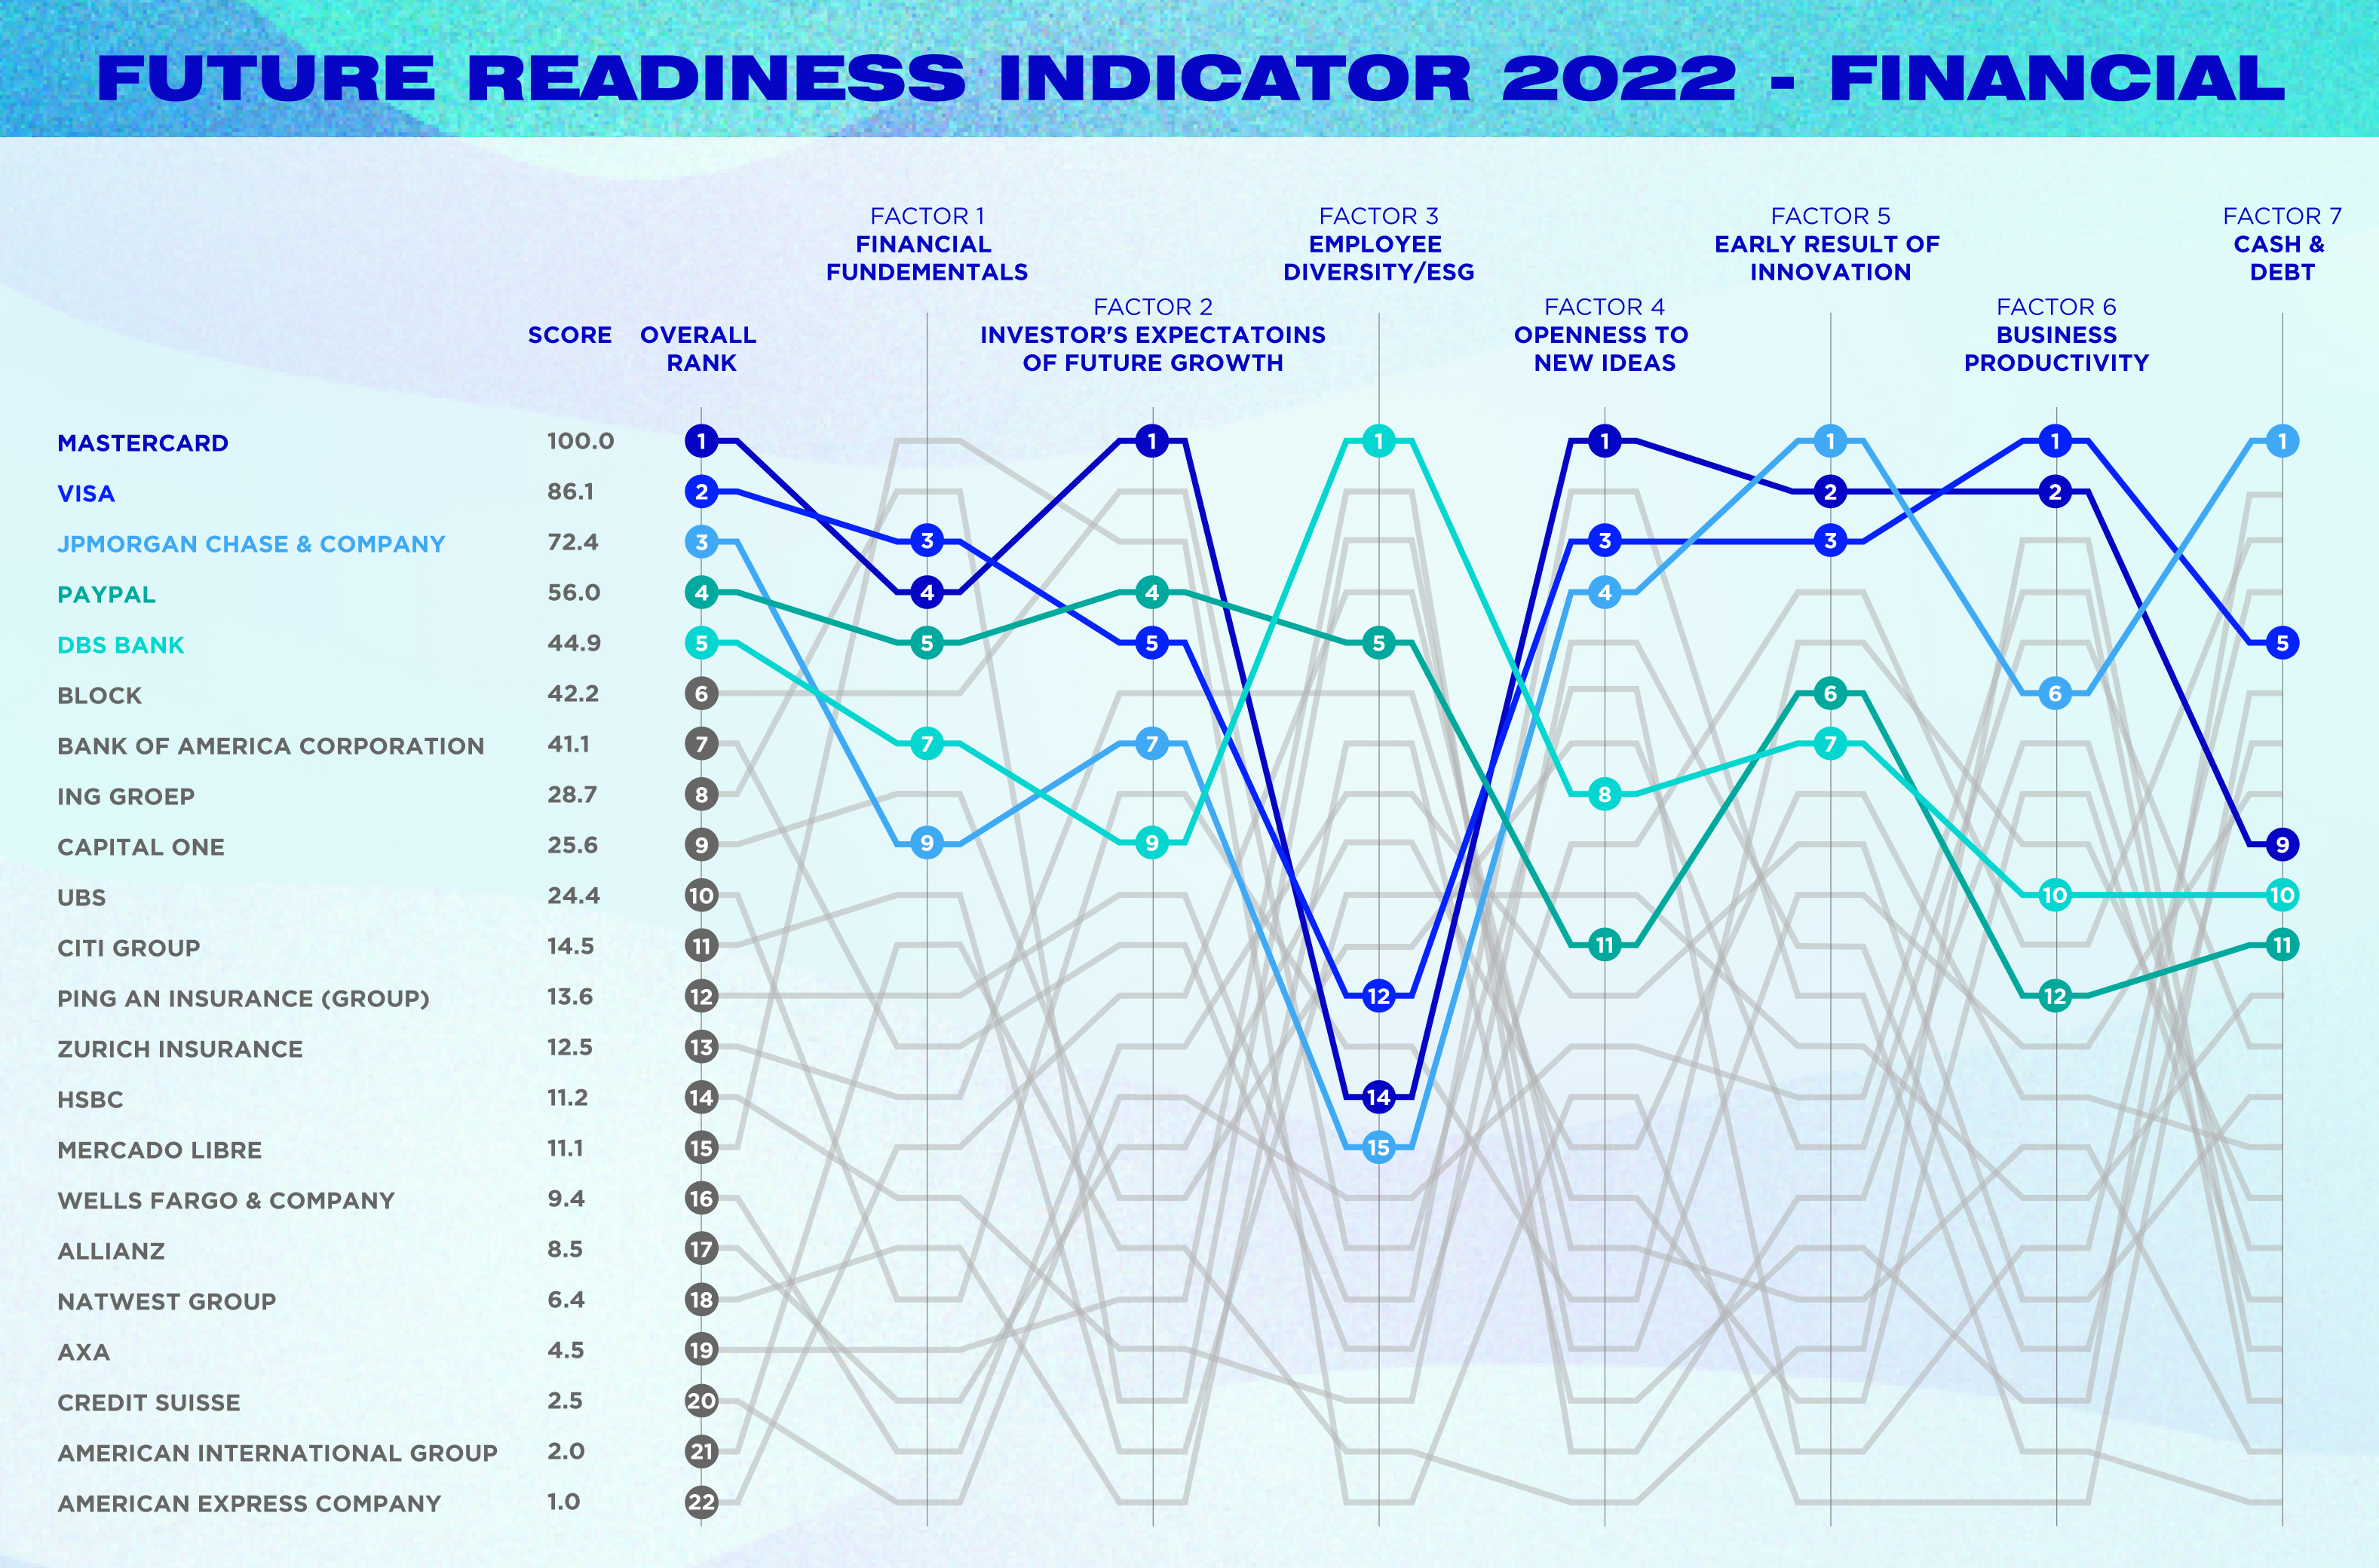
We also look at ESG (environmental, social and governance) performance, including the diversity of senior management, which correlates with innovation. Specifically, for banks, we look at the proportion of women on the board and executive team. We also explore the background of the CEO, because industry outsiders bring fresh perspectives. In addition, we look at the competitiveness of the country where the company is headquartered, to gauge the ease of doing business.
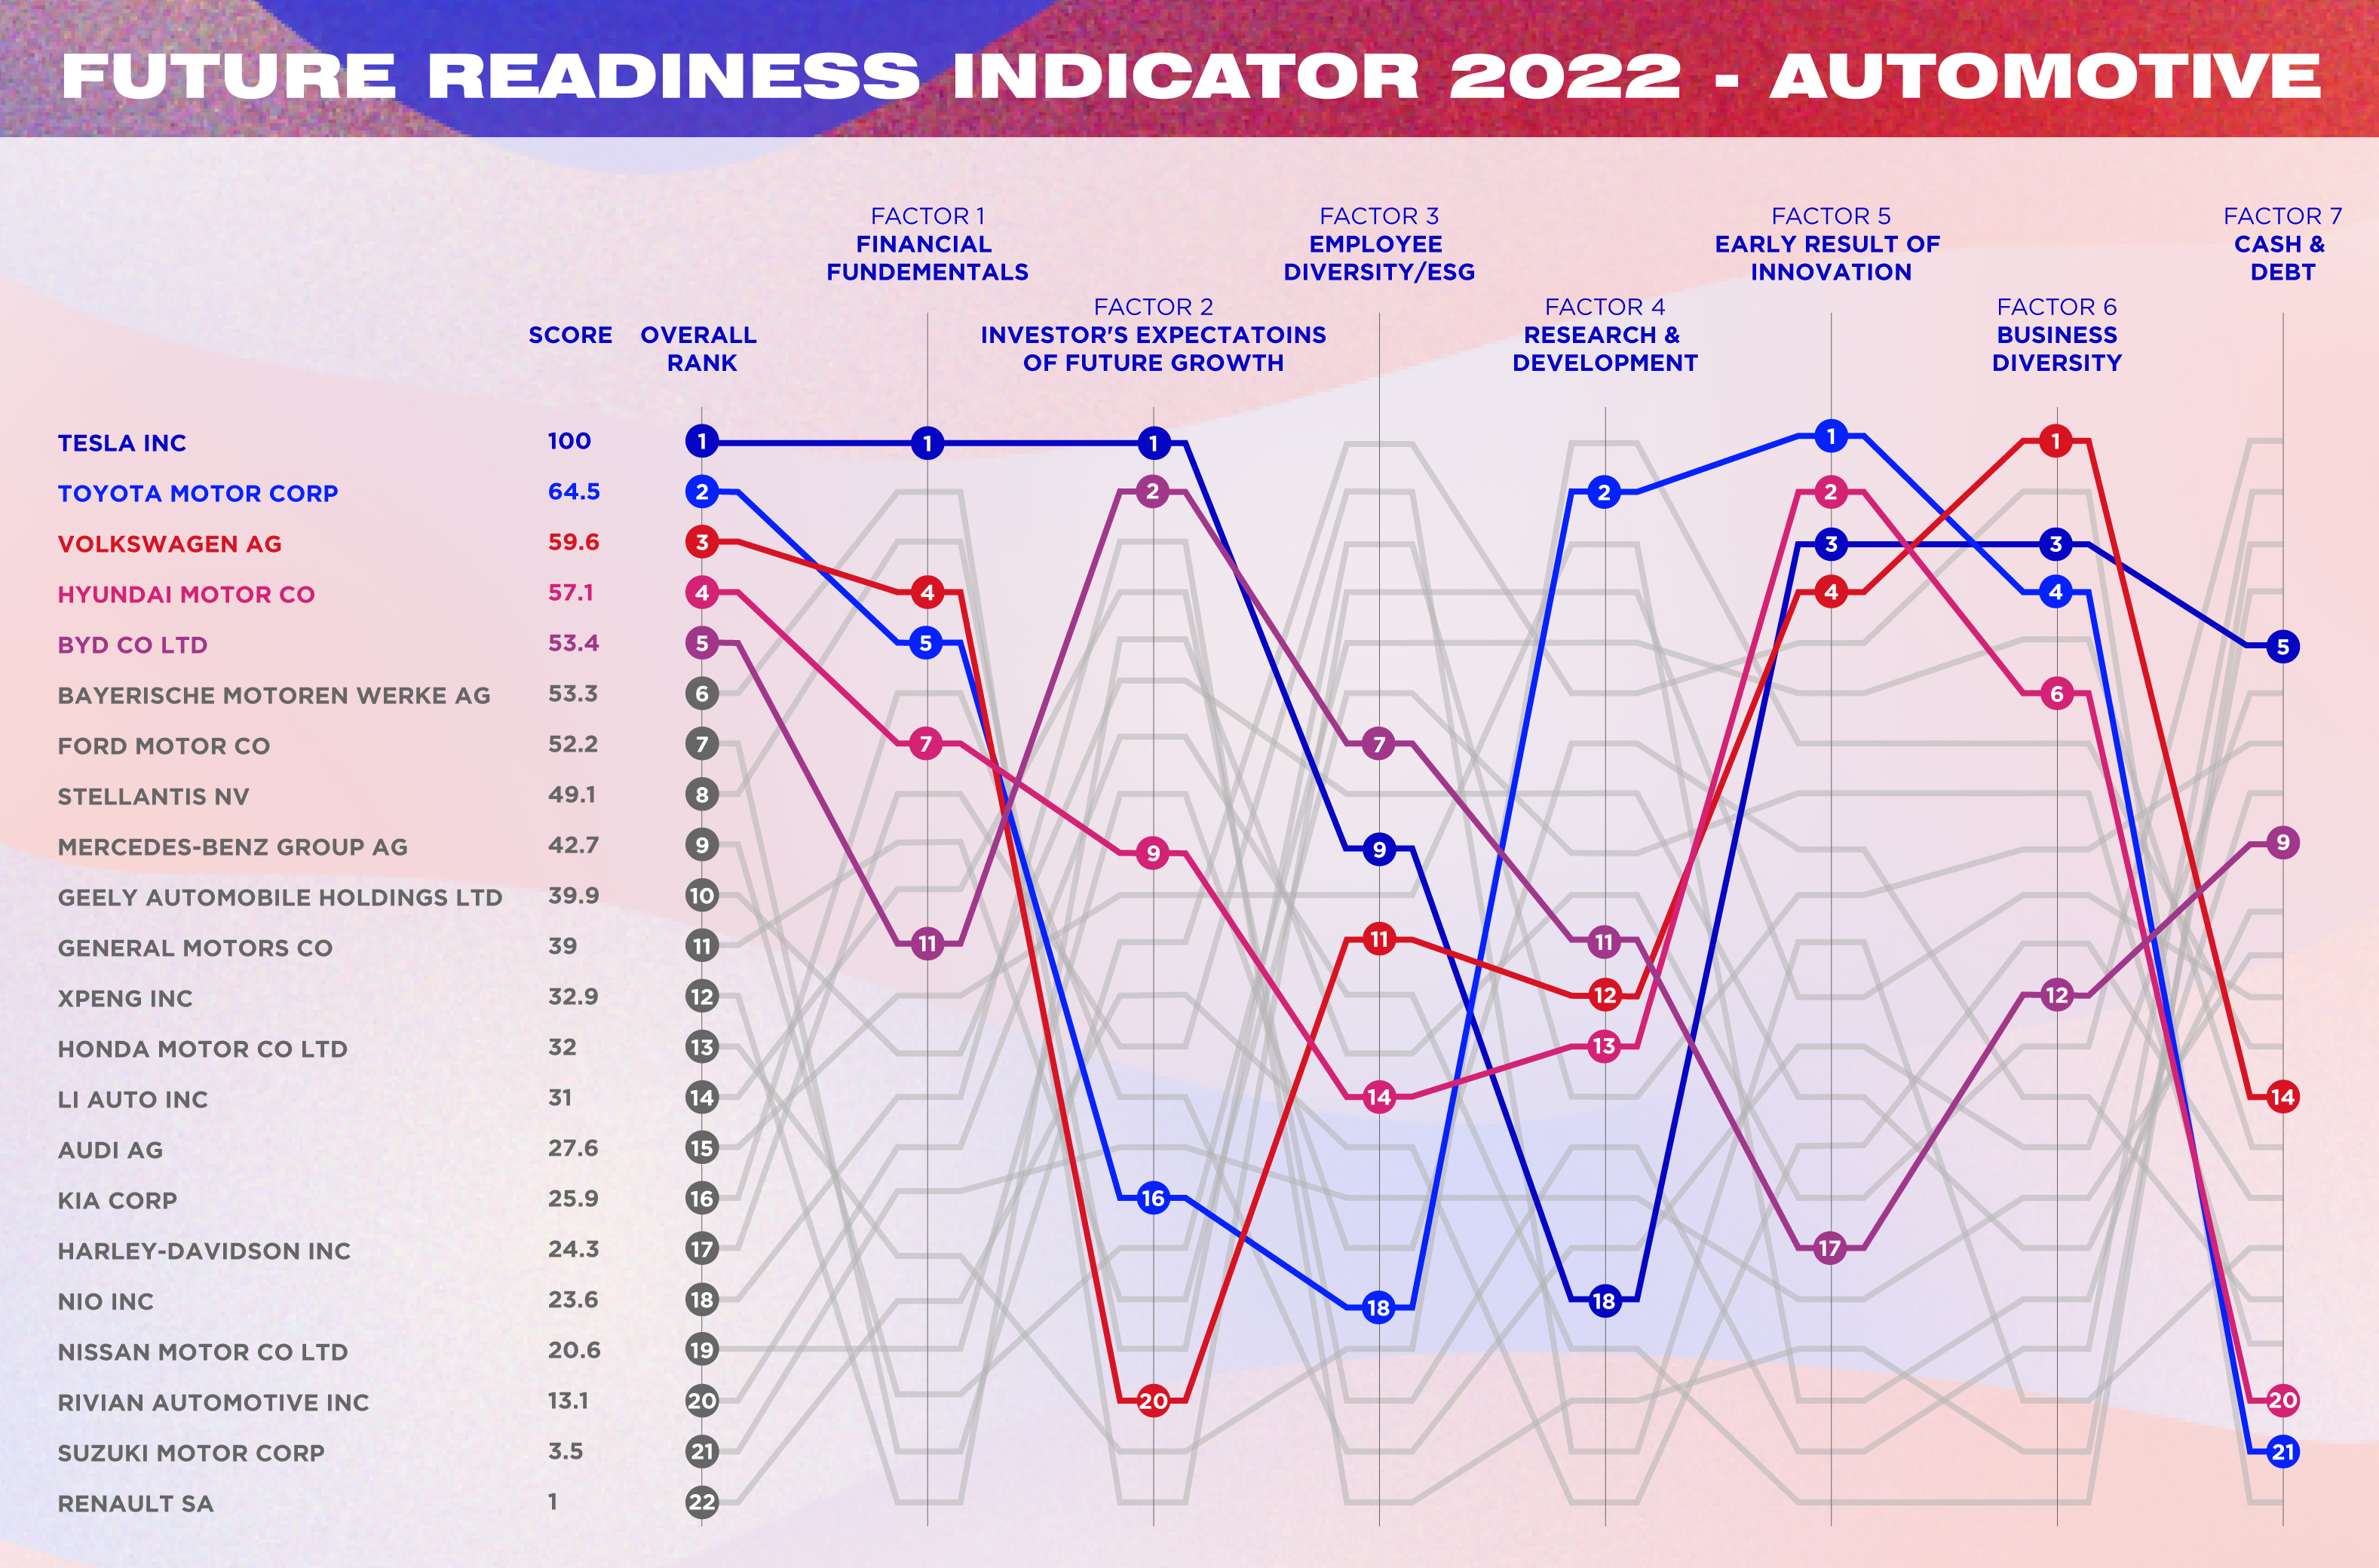
Sustainability makes good business sense. By reducing energy and waste, a company can lower costs and even generate additional revenue. Tesla, for one, has been selling carbon credits for years. This used to be its main source of income, before it was producing electric vehicles profitably.
We have created a company’s ESG score based on existing scores from ratings agencies, but taking into account governance controversies reported by the media. Tesla, for instance, should in theory score highly for ESG, given the green credentials of electric vehicles. But, it scores poorly because of chief executive Elon Musk’s own governance issues. In 2018, for example, he and Tesla were fined $40m by a regulator because Musk tweeted (dishonestly) that he had “funding secured” to take Tesla private.
Saving for a rainy day
In addition, we measure a company’s cash buffer, the amount set aside for a rainy day. This includes cash to total assets — the portion of assets held in cash or near-cash securities. A high cash ratio indicates safety. We also look at total debt to equity, which evaluates a company’s financial leverage by dividing total liabilities by shareholder equity. This measures how much a company finances its operations through debt, as opposed to growth, and the ability of shareholder equity to cover outstanding debts.
Performing well across all these dimensions is hard, but doing that can lead to better performance on the stock market, which is the seventh metric of the Future Readiness Indicator. We assess stock market performance in terms of the five-year average price to earnings ratio. A high P/E ratio means investors are willing to pay a high share price today because they expect higher growth in future.
Further, we gauge the three-year average market capitalization, or how much a company is worth, and the price to book value, the ratio of the market value of shares over a company’s assets on the balance sheet.
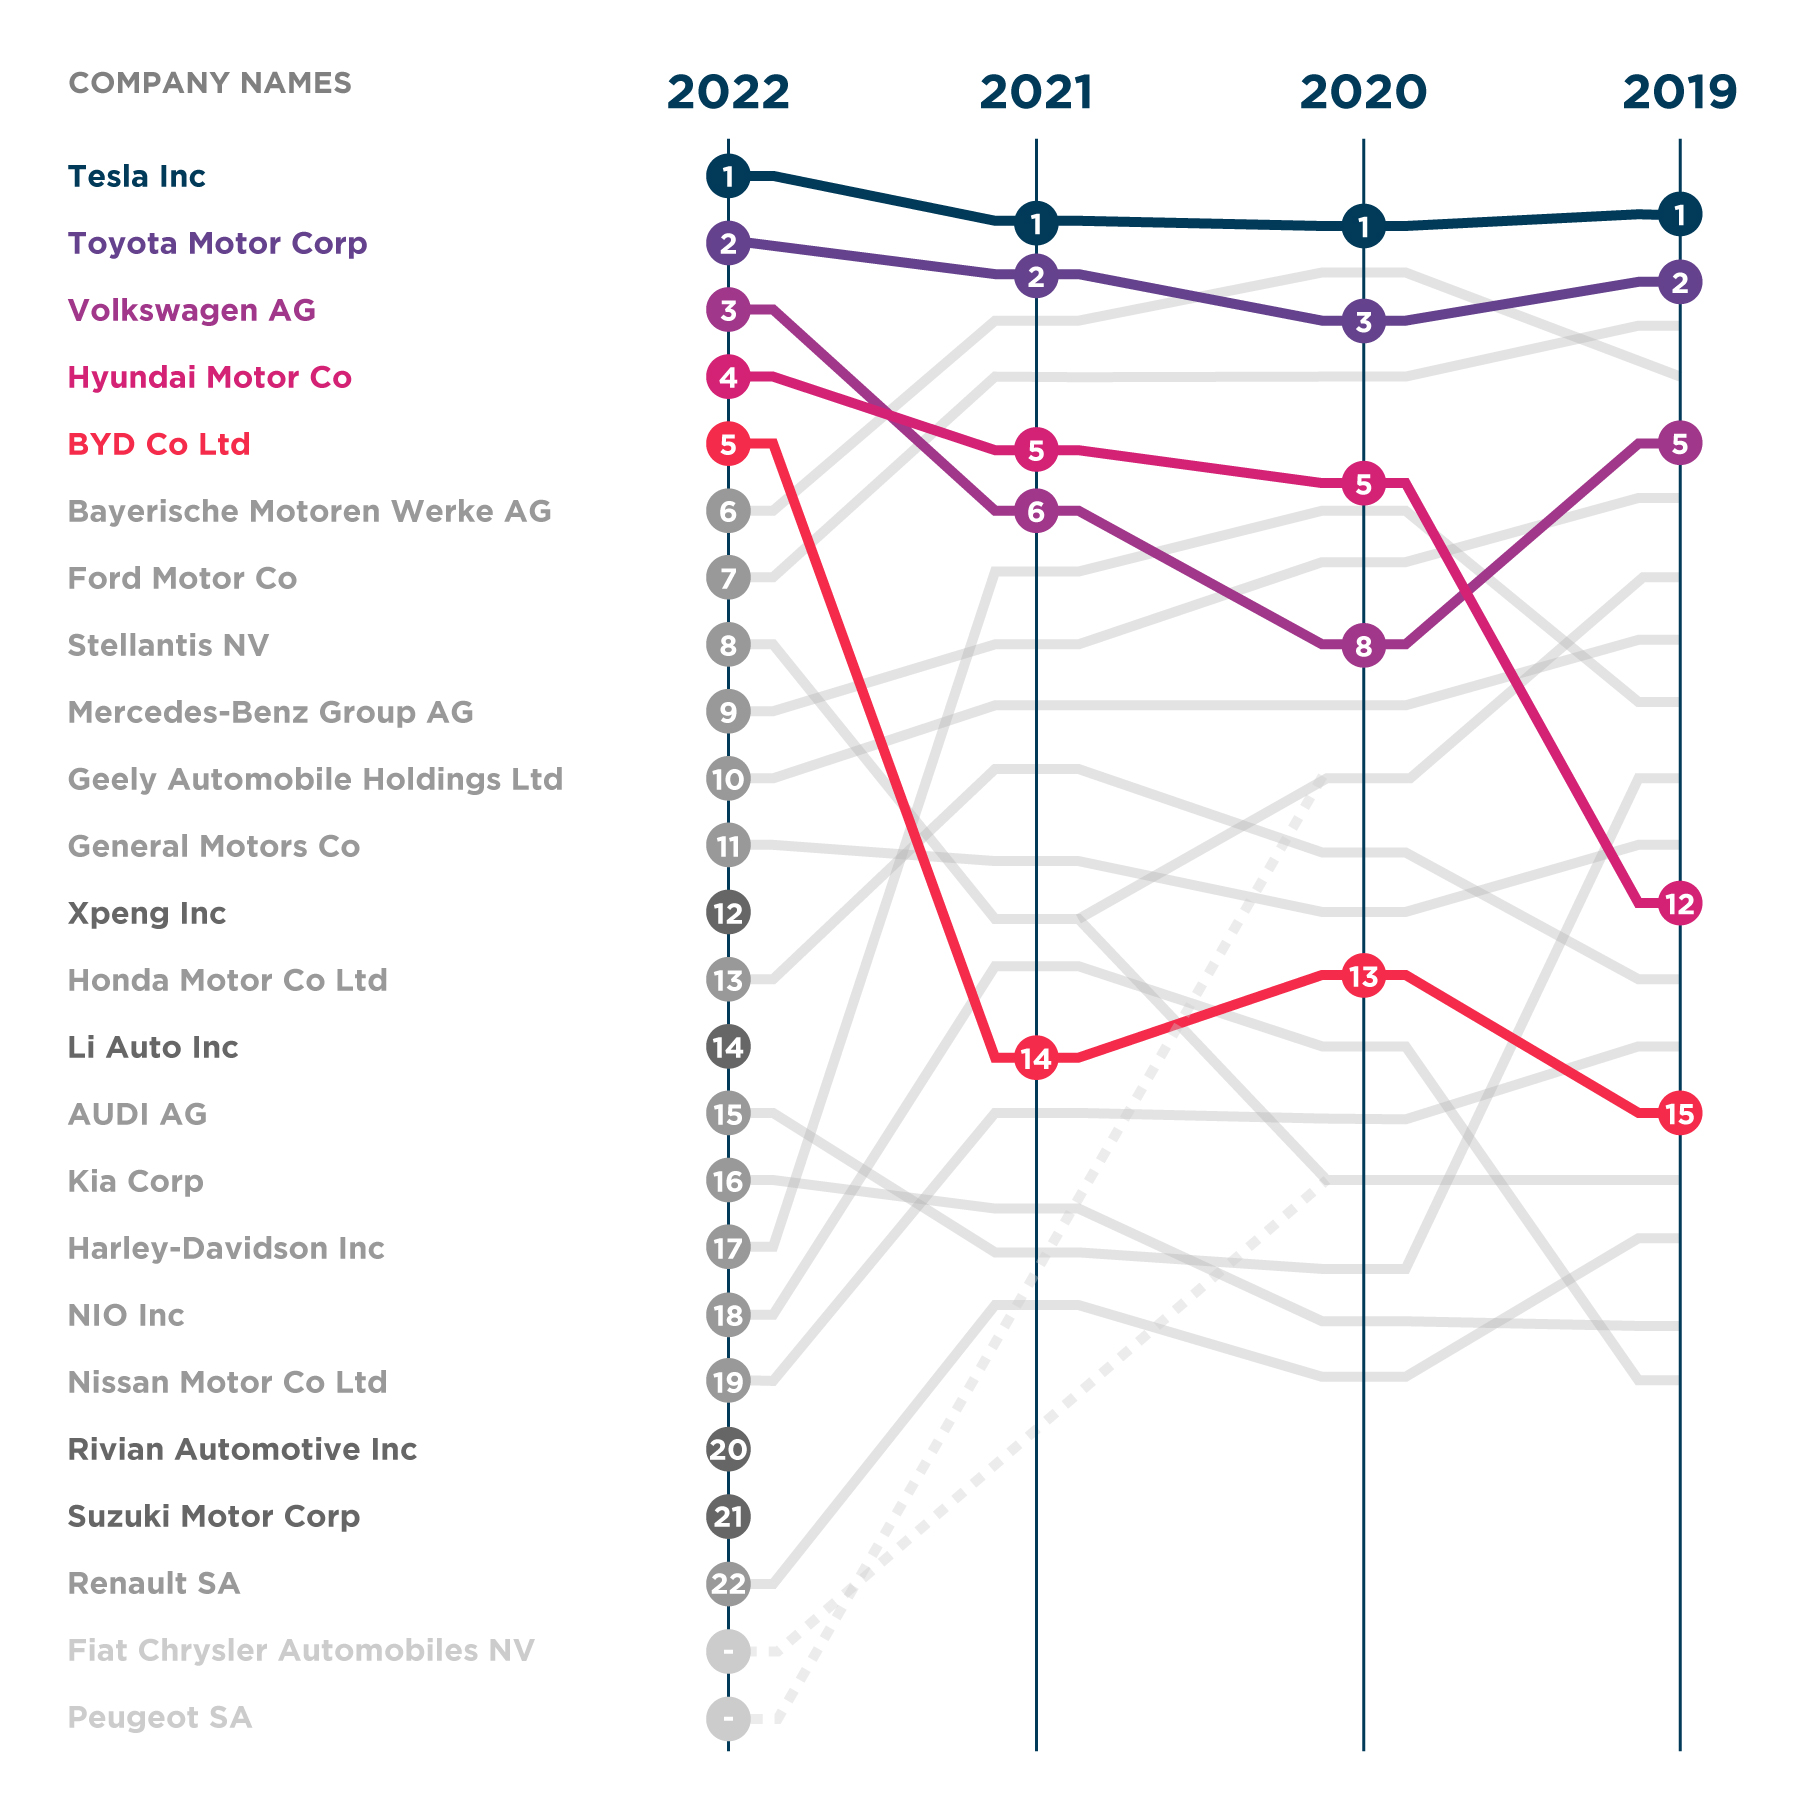
We use all of these metrics to produce a balanced composite score for our resulting industry rankings. And what they show is that the most future-ready companies exhibit specific behaviors that make them more likely to successfully navigate the mounting macro problems facing executives today, and whatever comes next.


