Country competitiveness and perceptions about the quality of life it offers
The executive survey employed in the development of the IMD world competitiveness ranking entices executives to reflect about the level (whether they consider it high or low) of their country’s quality of life. Intuitively one may conclude ex ante that the GDP of a particular country determines its quality of life. And yet, as we will observe shortly, GDP cannot fully explain certain patterns in the data.
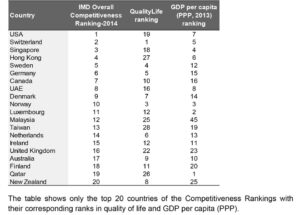
The correlation between GDP/quality of life is confirmed by some of the top 10 countries of the overall competitiveness ranking. Switzerland and Norway place in the top 10 of the competitiveness ranking, life quality criterion, and in terms of GDP PPP per capita (please note that GDP ‘rankings’ refer only to countries included in the World Competitiveness Yearbook). Other top 10 countries in both competitiveness and life quality are Canada, Denmark, Germany and Sweden; they, however, fall outside the top 10 GDP (16th, 14th, 15th and 12th respectively).
Executives residing in other top 10 competitiveness countries, however, find the quality of life in those countries in need of enrichment; for example, the USA ranks first in competitiveness but emerges in the 19th position in quality of life. Similarly, Singapore ranks third and 18th, while both the USA and Singapore are in the top 10 GDP. Hong Kong and UAE experience similar patterns. Conversely, there are countries achieving high scoring in the quality of life but lower rankings in competitiveness. Austria ranks 22nd in overall competitiveness but second in life quality, Australia ranks 17th and ninth while both counties are top 10 GDP. Outside the top 10 GDP, we observe similar patterns. The Netherlands ranks 14th in competitiveness while placing sixth in life quality, New Zealand ranks 20th and eight, Spain ranks 39th and 21st and Greece ranks 57th and 40th.µ

Such trends indicate that there are other underlining elements that contribute to the quality of life. These factors include a healthy environment, the individuals’ ability to meet their “material” expectations (e.g., access to specific goods and services), life satisfaction (e.g., ability to enjoy family time), levels of equality (e.g., gender equality) and absence of threats (e.g., effective policies against crime and protection of individual rights). A test (not shown) of the relationship between the quality of life and gender inequality, for example, shows that indeed gender inequality is statistically significant in explaining the quality of life.
Research Information & Knowledge Hub for additional information on IMD publications
IMD produces a yearly Smart City Index offering a balanced focus on economic and technological aspects of smart cities on the one hand, and “humane dimensions” of smart cities (quality of life, environment, and inclusiveness) on the other. In this...

The European Commission is once again focused on boosting Europe’s competitiveness, this time by integrating the bloc’s capital markets. The EU executive published a range of measures on March 19, aimed at unlocking the €11.6 trillion ($12.8 trill...
We extend the mixed gamble perspective to explain how family-controlled firms frame and evaluate the difficult trade-off between potential gains and losses in financial wealth (FW) and socioemotional wealth (SEW) when pursuing portfolio-level stra...
Foreign firm access to the public procurement markets—valued at some $13 trillion worldwide—is not governed by standard trade policies and multilateral trade accords. In trade policy circles, failure to publish procurement tenders in a global lang...
Research Information & Knowledge Hub for additional information on IMD publications
Published by International Institute for Management Development ©2025
Research Information & Knowledge Hub for additional information on IMD publications
in I by IMD
Research Information & Knowledge Hub for additional information on IMD publications
Research Information & Knowledge Hub for additional information on IMD publications
IMD World Competitiveness Center Report, 8 April 2025
Research Information & Knowledge Hub for additional information on IMD publications
Research Information & Knowledge Hub for additional information on IMD publications
in Journal of Management Studies 20 March 2025, ePub before print, https://doi.org/10.1111/joms.13218
Research Information & Knowledge Hub for additional information on IMD publications
Research Information & Knowledge Hub for additional information on IMD publications
Research Information & Knowledge Hub for additional information on IMD publications
in The Quarterly Review of Economics and Finance January 2025, vol. 99, 101898, https://doi.org/10.1016/j.qref.2024.101898
Research Information & Knowledge Hub for additional information on IMD publications


