On September 26, we are launching the third edition of the IMD World Digital Competitiveness Ranking (WDCR). It assesses an economy’s aptitude to adapt and explore digital technologies that transform business models, government practices and the society in general.
To evaluate an economy, WDCR examines three factors: knowledge, which measures the capacity to understand and learn the new technologies; technology, which evaluates the competence of an economy to develop new digital innovations; and future readiness, which assesses the preparedness for the coming developments.
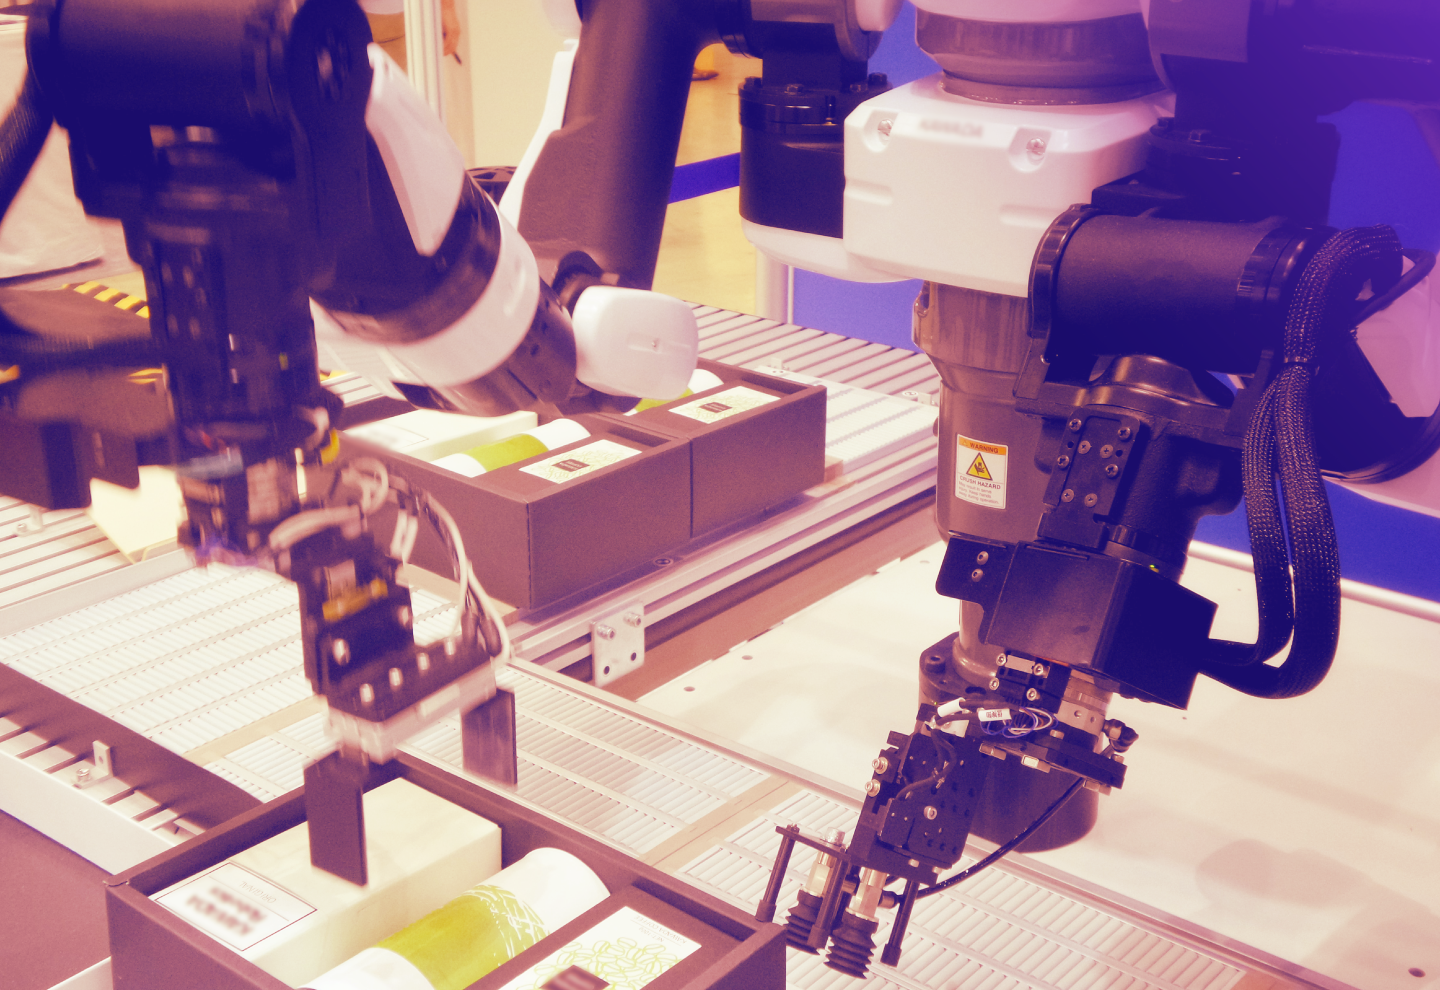
This year, two new variables are introduced in the calculation of the WDCR, both related to robotics. Robots, that is, programmable machines that perform different tasks, are part of the new technologies introduced in different areas of our lives. In the context of the WDCR, we are incorporating two series: “industrial robot” that measures the total number of robots in operation and specifically “robots in education and R&D” worldwide. The data is provided by the International Federation of Robotics.
As it is expected, the robots used are unequally distributed worldwide. Five countries employ the highest share of robots that accounts for almost 75% of the total number of robots worldwide. These countries, in order of strength, are: China, Japan, the Republic of Korea, USA and Germany.
Figure 1 provides a visualization of the allocation of industrial robots worldwide. China has the highest number of robots, with a worldwide share equal to 23.5%. Qatar has the lowest number of robots, with a share equal to .0002%.

Figure 2 provides a similar visualization only this time it captures the number of robots employed in education and R&D. The distribution is similarly unequal. The top five countries command a share equal to 65% of the total number of robots worldwide. This time, beginning with the economy using the highest number of robots, the countries are: China, followed by Germany, USA, Japan and France. China engages 1899 robots with a share equal to 22% while several economies including Hong Kong, Iceland, Qatar, and Saudi Arabia among others do not have any operational robot.

In recent years, there has been significant research on what the effect of automation and robots is and will be in an economy. Of particular importance is the question about the future of labor. Does the introduction of robots specifically, and automation in general, result in a decline of the need for workers? Or will the trend be that with the advent of robots, new tasks will be identified and introduced and, therefore, the implications will be less severe than thought?
Irrespective of the effect on the labor markets, the introduction of robotics is expected to impact productivity. Figure 3 outlines this relationship in the three largest owners of industrial robots worldwide: China, Japan and the Republic of Korea. It captures the association between the number of robots employed and the change in the productivity in industries, measured in PPP units.

Figure 3 depicts the stock of industrial robots measured on the left vertical axis. The right axis provides the productivity growth in industries. The horizontal axis shows the seven years on which we have information on robots. Each bar denotes the stock of robots available in the three Asian economies.
Note that while China enjoys a substantial increase in the robots employed, this is not the case for Japan. In fact, Japan had realized a small decrease in the number of robots employed between 2011 and 1017, while Korea shows a small and steady increase in the number of robots employed. Interestingly, there does not seem to be a strong and consistent relationship with the productivity data. For each country, the colored curve depicts the productivity growth in industries per year. Thus, we observe, for instance, that the Japanese and Chinese productivity follow an opposite evolution.
The underlying important issue is the unequal distribution of this form of automation. The first-mover advantage that the five economies have in the area of robotics compared with the rest of the economies is impressive in terms of experience and learning-by-doing. Undoubtedly, it provides a substantial advantage in the application of new technologies. Will then this result in an increased digital inequality?


Switzerland has reached an uncomfortable conclusion: that UBS has become too large for the state to comfortably stand behind. The government’s plan to force the bank to hold roughly $20 billion more in capital is an attempt to close that gap, even...


As oil prices have soared following the outbreak of war in Iran, electric vehicles are back in focus. But the biggest beneficiaries are not American or European brands. They are Chinese manufacturers and, increasingly, Japanese carmakers building ...
Research Information & Knowledge Hub for additional information on IMD publications
Research Information & Knowledge Hub for additional information on IMD publications
Research Information & Knowledge Hub for additional information on IMD publications
Research Information & Knowledge Hub for additional information on IMD publications
Research Information & Knowledge Hub for additional information on IMD publications
Research Information & Knowledge Hub for additional information on IMD publications
Research Information & Knowledge Hub for additional information on IMD publications
Research Information & Knowledge Hub for additional information on IMD publications
Research Information & Knowledge Hub for additional information on IMD publications
Research Information & Knowledge Hub for additional information on IMD publications