Sustainability Resolution
We all strive for new beginnings and the start of a new year provides the best opportunity to align such deeds. It is manifested with the ancient tradition of making resolutions, promises that is, to align our behavior in such a way as to accomplish a positive target. Be it to eat healthier, exercise more, balance our time between work and family or learn a new language, musical instrument or how to … code, you make a start for a brighter future.
Not surprisingly, communities and countries often make similar … promises. The one that connects most countries is the understanding that we must protect the welfare of future generations while satisfying our current needs. This trade-off between future and current needs defines sustainability. In fact, the necessity of such a … resolution, led the UN to adopt the 17 Sustainable Goals in 2015.
I think that it is timely to explore this analogy in the first Criterion of the Month of 2019 and focus on one of the sustainable development goals: energy.
Energy, to paraphrase slightly, makes the world go around. It is the “ability to do work.” Developed countries have a high demand for energy while such a demand is increasing in the developing countries as well. According to the independent research and consulting firm Enerdata the world total energy consumption increased by 37% between 2002 and 2017 (https://yearbook.enerdata.net/total-energy/world-consumption-statistics.html).
In the IMD World Competitiveness Yearbook we provide data for the “Total final energy consumption per capita” for each of the 63 economies we study. To link the energy consumption and the general level of development of an economy, Figure 1 plots the relationship between the energy consumption per individual in the vertical axis and the GDP (in purchase power parity units) per individual in the horizontal. We have highlighted some countries to illustrate several points.
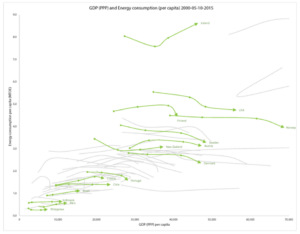
We observe that, on the average, individuals in countries with GDP per capita lower than $20,000 consume more energy than in the past. As expected, in these countries part of the increase in per capita income the last 15 years is allocated towards the use of additional energy.
The opposite is observed in countries with more than $40,000 per capita. Here, individuals, on the average, consume less energy compared to five years ago. The exception to this trend is Iceland where the per capita consumption of energy has been increasing the last ten years. Is this really a problem for Iceland and by extension for the rest of the world?
Energy can be categorized as renewable and nonrenewable. The former can be replenished while this is not the case with the latter. Iceland controls geothermal and hydropower capacity to such an extent that its energy supply is dominated by renewable sources.
Renewable resources contribute to the world sustainability efforts. It is crucial, therefore, to examine a country’s evolution in employing renewable energy resources. Figure 2 summarizes several dimensions related to the share of renewables to total energy for different countries. In the horizontal axis we measure the share in 2010. In the vertical we calculate the difference in the share of renewables between the years 2005 and 2010. In red are denoted countries where the share of renewables declined in this period, like China, Indonesia, Philippines and Norway among others. They represent approximately 28% of the countries we study.
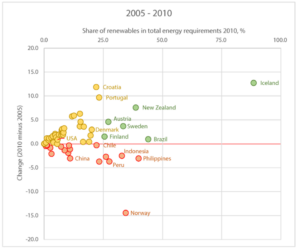
In yellow are indicated the countries, which improved the use of renewables in their energy consumption and which in 2010 engaged less than 25% renewables, for instance Croatia, Denmark and Portugal among others. Finally, the green positions denote countries that increased their share of renewables and in 2010 involved more than 25% renewables in their energy supply. Countries like Austria, New Zealand and Sweden along with Iceland engaged the highest share of renewables!
Figure 3 captures the progression in the subsequent 5-year period. To make it easier to see how the previous front-runners and the ones who had lagged behind evolved, we keep the same color representation.
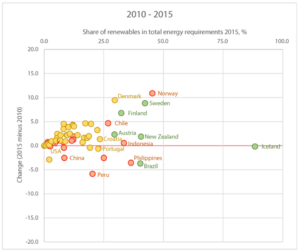
Figure 3 paints a rather encouraging picture. In our sample of mid- and high-income economies, countries that use more than 25% renewables increased from 10% to 15%. When large consumers of energy, like China, manage to generate more energy from renewable resources than the needs of the economy, this picture may become even more favorable.
On a personal level, most of our New Year resolutions expire quickly, unfortunately. There are different reasons for this, yet, the fact that we are working towards these goals individually is an important one. This is not the case for the sustainability goals. They have been accepted as a major objective by many countries and the coordination by an international entity provides the necessary… nudging. Despite the occasional backslide on promises and commitments by different countries, there is no doubt that sustainability targets can be accomplished only through international collaboration. Balancing the long term environmental benefits with the short term political aspirations, deciding upon the priorities and working towards co-creating structures that will allow for innovation towards sustainability are the challenges not only for 2019 but for years to come.
Research Information & Knowledge Hub for additional information on IMD publications
In President Trump’s second term, a variety of executive actions have reversed social progress. Withdrawing from the Paris Climate Agreement presents a significant challenge to bending the global emissions curve since it is one of the world’s larg...
We systematically review business research concerning the planetary boundaries framework: A natural science framework that identifies nine Earth system boundaries that govern the safe operating space for humanity. Ten years after the introduction ...
Environmental claims are becoming increasingly common in corporate disclosures, but whether they correspond to genuine environmental action rather than greenwashing remains unclear. This paper explores the relationship between companies' environme...
Published by International Institute for Management Development ©2025
Research Information & Knowledge Hub for additional information on IMD publications
in I by IMD
Research Information & Knowledge Hub for additional information on IMD publications
Research Information & Knowledge Hub for additional information on IMD publications
Research Information & Knowledge Hub for additional information on IMD publications
Research Information & Knowledge Hub for additional information on IMD publications
in Stanford Social Innovation Review Online 2 June 2025
Research Information & Knowledge Hub for additional information on IMD publications
in Journal of Management Studies June 2025, vol. 62, no.4, pp. 1811-1846, https://doi.org/10.1111/joms.13150
Research Information & Knowledge Hub for additional information on IMD publications
in Sustainable Development 29 May 2025, ePub before print, https://doi.org/10.1002/sd.3544
Research Information & Knowledge Hub for additional information on IMD publications
Research Information & Knowledge Hub for additional information on IMD publications
in I by IMD
Research Information & Knowledge Hub for additional information on IMD publications


