
Measuring
Understanding our carbon footprint is an important first step towards taking responsibility and identifying key initiatives to reduce our environmental impact.
![]()
![]()

Our Carbon Strategy
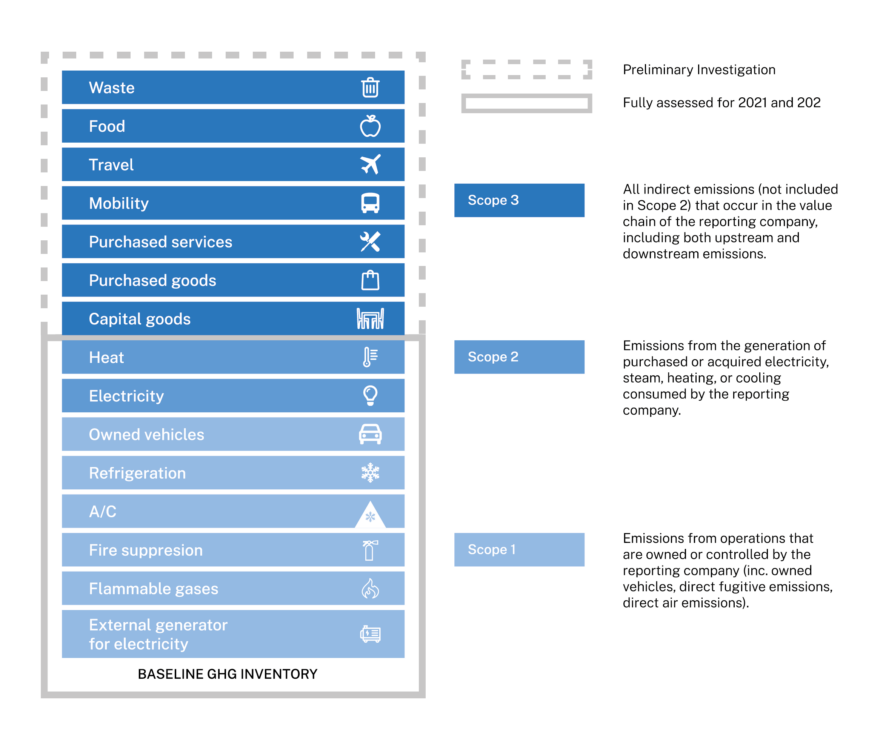
In 2022, we completed a comprehensive audit of our carbon emissions based on the GHG Protocol, an internationally accepted method for companies to measure, manage, and report their greenhouse gas emissions. The study encompasses all three scopes. Categories included in the carbon footprint assessment by scope.
We have analyzed all aspects of IMD’s operations and engaged a wide range of key stakeholders over more than six months to ensure our measurement is thorough. We are now ready to propose and model key mitigation actions for the future.
2022
2023 Plan
Emissions related to IMD activities totalled 2’606 metric tons of CO2 in 2021. Preliminary calculations showed that Scope 3 accounted for more than 79% of our impact.
In 2022 Scope 1 and 2 equalled to 522.5 tons of CO2, compared with 526 the previous year. According to the GHG protocol the reporting company should report both location and market based values for scope 2. For IMD the values for 2021 are 700 t CO2eq. and 245 respectively and they don’t differ much from the 2022 values 697 t CO2eq, 239 respectively.
Nevertheless, as a basis for our reduction strategy, a tailored impact factor was used which better reflects the situation of energy production and consumption in Switzerland (main centre of our operations).
While 2022 Scope 3 measurements are under review, we foresee an increase in certain categories such as goods, food, waste, and travel compared with 2021, due to the growth of IMD’s business and the end of COVID policies around the world.
| Scope | 2021 tons CO2eq | 2022 tons CO2eq |
| 1 | 12.7 | 13.6 |
| 2 Hybrid | 513 | 508.9 |
| 2 Market based | 245 | 239 |
| 2 Location based | 700 | 697 |
| 3 | 2080 | NA |
| TOTAL (hybrid) | 2605.7 | 522.5 |
In 2021 Scope 1 made up less than 1% of total CO2 emissions with refrigerants contributing to 69% of this. Scope 2 emissions made up 19.7% of total emissions with 52% coming from electricity and 48% from heat.
In 2022 Scope 1 and 2 contributions did not differ significantly from 2021. Refrigerants still accounted for 65% of scope 1 emissions (see orange charts) while electricity made up 53% and heating 47% of scope 2 emissions (see blue charts).
Scope 3 emissions can include employee commuting and business travel. For the calculation, we included staff travel and mandatory travel that takes place during executive education and degree programs, such as MBA and EMBA Discovery Expeditions. The GHG Protocol considers participant travel to and from program locations an optional category, as it is similar to customer travel to and from a store.
We reported an estimate of these emissions for 2021 but kept it separate from overall Scope 3 emissions as the mitigation efforts for this category differ from staff travel, over which we have more control. The estimate for participant travel is about 0.5 metric tons per person, for a total of about 16,400 program participants in 2021.
While there may be no consensus on whether to include participants’ travel under our Scope 3 emissions or those of our clients, by disclosing these emissions we can encourage others to also take a comprehensive, transparent approach to sustainability.